FA EDA

FA EDA is a BS based data analysis system (EDA) developed by FA Software. It can collect and analyze a variety of data generated during the production process to help users find problems in production, provides better control and improve product quality.
FA EDA supports a variety of data input methods, including automatic reading of various test files, and obtain directly from the equipment via EAP.
FA EDA is currently mainly positioned in the automatic collection and analysis of PCM and CP data, and will support more types of data analysis in the future.
This module realizes automatic reading of test data files, generates standardized data and stores them in the database, and archives and manages the data files.
This module realizes automatic reading of test data files, generates standardized data and stores them in the database, and archives and manages the data files.

The module monitors the data imported by the "automatic data collection module" in real time, and according to the set monitoring items, finds abnormal data in ...
The module monitors the data imported by the "automatic data collection module" in real time, and according to the set monitoring items, finds abnormal data in real time and triggers an alarm. According to the settings, it can execute actions such as hold batch or hold equipment.
The main functions of this module are:
-Monitoring Job setting function
-Data monitoring function
For the selected job, this module uses graphical controls to display the values of the XBar, MR, and R of the collected data in the coordinates. After selecting...
For the selected job, this module uses graphical controls to display the values of the XBar, MR, and R of the collected data in the coordinates. After selecting the point, you can see the original data and related collection information, which can be displayed on the graph control line.
Support multiple charts for offline statistical analysis of process parameters (XBar-Sigma/XBar-Range/Moving Range/P/Pn/Count, etc.). For the selected Chart Point, parameters such as Max, Min, Cp, Cpk, Std Dev, and Ca can be calculated.
Support graphics conversion function, the same data can be switched and displayed between Control Chart, Histogram, Normal Prob, etc., and support for data distribution display based on raw data (Histogram Chart/BoxPlot/Probability Chart/Normalize Line, etc.).
This module provides data analysis function for PCM test, the main functions are:
This module provides data analysis function for PCM test, the main functions are:
-PCM data query and analysis
Provide query analysis based on day, week, month, custom time period, product, process route, process, process step, PCM parameter and other conditions, support single wafer and multi wafer/lot query analysis, support generates a PCM Map based on PCM parameters, support export the raw data of PCM parameters and summary export to Excel according to conditions.
-PCM parameter failure analysis
Analyze the data obtained by query according to the query conditions, support query and analysis by single wafer and multiple wafer/lot, and support the generation of SPC control chart for analysis based on the value of each PCM test parameter.
-PCM parameter correlation analysis
Support correlation analysis between PCM parameters or between PCM parameters and yield, support correlation analysis between PCM parameters and process parameters, support analysis of correlation between PCM parameters through scatter diagrams


Bin/Defect Map defect analysis is mainly used for Bin and Defect analysis of CP measured data. The system supports analysis by Lot and Wafer. Supports query and...
Bin/Defect Map defect analysis is mainly used for Bin and Defect analysis of CP measured data. The system supports analysis by Lot and Wafer. Supports query and analysis of Bin and Defect data based on conditions such as time range, product, process route, process, process step, and inspection equipment.
Can display Bin/Defect Map according to single wafer/multiple wafers/Lot, support displaying the actual size of Defect on Defect Map, support the link between Defect actual picture and Defect point on Map, and support the summary and conditional query of Bin/Defect original data export to Excel.
Provide Bin and Defect Map overlay display analysis, and provide multiple condition query function, support Wafer Mapping map zoom in, zoom out, rotate, copy and other functions.

The module supports data query and analysis based on days, weeks, months, and custom time periods, as well as data query and analysis based on conditions such as factories, products, process routes, process, process step, and inspection equipment.
The module supports data query and analysis based on days, weeks, months, and custom time periods, as well as data query and analysis based on conditions such as factories, products, process routes, process, process step, and inspection equipment.
Support the selection of the Lot/Wafer to be analyzed, support the statistical yield summary report according to the selected Lot/Wafer, and support the display of the yield trend chart of the work-in-process according to the time period selected.

This module provides basic settings for the system, the main functions are:
This module provides basic settings for the system, the main functions are:
-Monitoring parameter settings, set the parameters to be monitored
-Product information settings
-User and user group settings
-User permission settings
-System maintainability, data, cleaning, migration and organization mechanism
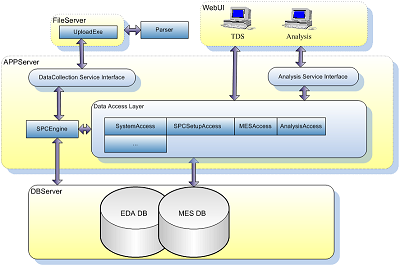
FA EDA uses Microsoft .Net architecture, which can be deployed on any server running Windows and supports Windows Server 2012 and above.
Microsoft's ClickOnce technology and B/S technology are used in the development technology, and users can access the system through a browser.
Oracle was used as the system's database engine.
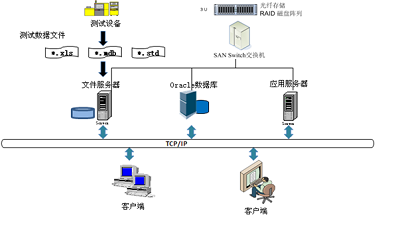
The number of FA EDA application servers can be increased or decreased at any time depending on the business volume, and load balancing can be achieved.
Supports Microsoft's NLB, which can realize load balancing of EDA application servers.
In terms of database, FA EDA supports Oracle RAC technology, which can realize high-concurrency business processing.
+86 021 5080 4093
contact@fa-software.com
#17-01, No.1198 Century Avenue, Shanghai, China